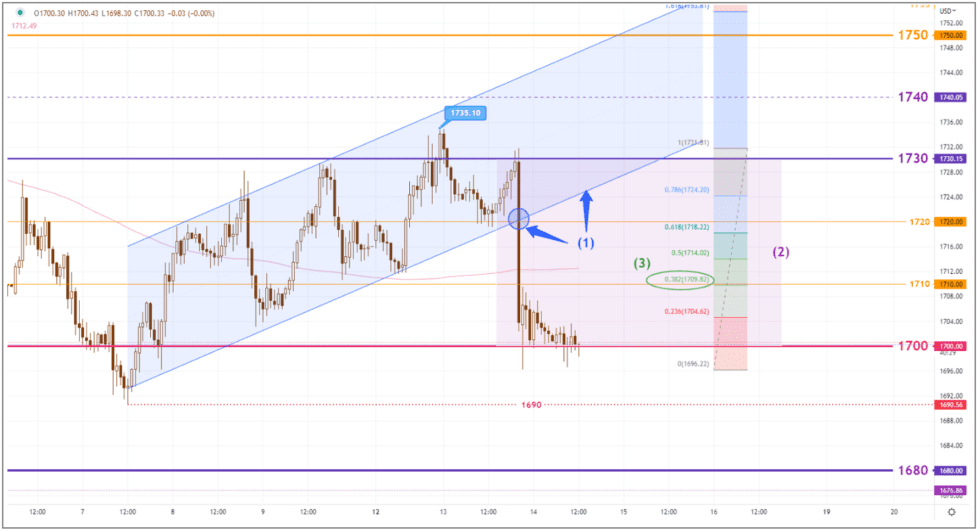

Gold pulled back near the 1-week high yesterday. The day began at 1724. and the price was bounded by 1720-30 during the early Asian and European sessions. Once the US released its inflation figures, the price broke out from the uptrend channel(1) and dipped to the day low near 1697. The day eventually ended at 1701, down by USD 23.
Although gold fell more than USD 20 yesterday, it still maintains its position within the 1700-30(2) range in the 1-hour chart. If an S-T rebound began in early trading, the upside target could be set at 1709(3).

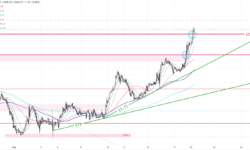
The selling has yet to show signs of slowing down on the daily chart. The price may test again at the bottom of the range(4) near 1690, later in the European or the US trading sessions.
S-T Resistances:
1720
1715
1709-10
Market price: 1700
S-T Supports:
1697
1690
1680
Risk Disclosure: Gold Bullion/Silver (“Bullion”) trading carries a high degree of risk, and may not be suitable for all investors. The high degree of leverage can work against you as well as for you. This article is for reference only and is not a solicitation or advice to trade any currencies and investment products . Before deciding to trade Bullion you should carefully consider your investment objectives, level of experience, and risk appetite. The possibility exists that you could sustain a loss of some or all of your initial investment or even more in extreme circumstances (such as Gapping underlying markets) and therefore, you should not invest money that you cannot afford to lose. You should be aware of all the risks associated with trading Bullion, and seek advice from an independent financial advisor if you require. Client should not make investment decision solely based on the point of view and information on this article.