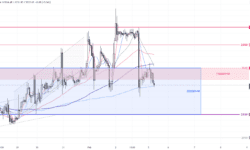
黄金价格自上月中从2000反弹向上后,一直未有明显的趋势,但从1H看就明显见到价格由下行 震荡变成上行震荡,开始出现HIGHER LOW。 虽然上周五未能升穿2063的前双顶,而且更发力向下爆,不过最后趋势没有延续向下和做成LOWER LOW,所以价格走势仍会 先看震荡和有机会向上压缩。 操作上仍是短线会较有优势,因为现时的区间是2063至上升趋势线大约40蚊左右 ,可能仍会向上收窄,所以在顶底范围才出手会较好。 K.LAM风险提示: 场外式黄金/白银交易涉及高度风险,未必适合 所有投资者。 高度的杠杆可为阁下带来负面或正面的影响。 阁下在决定买卖场外式黄金/白银之前应审慎考虑自己的投资目标、交易经验以及风险接受程度。 可能出现的情况包括蒙受部分或全部初始投资额的损失,或在极端情况下(例如相关市场跳空)产生更多的损失。 因此,阁下不应将无法承受损失的资金用于投资。 投资应知悉买卖场外式黄金/白银有关的一切风险,如有需要,请向独立财务顾问寻求意见。 市场资料仅供参考,MAX Online 绝不保证分析内容的准确性。
美國中央銀行家希望在他們更有信心通脹會下降到2%之前不要降息,並且在周三提出了一系列理由,說明他們對於盡快開始寬鬆貨幣政策或者一旦開始就迅速行動感到不急迫。 上周,美聯儲將政策利率保持在5.25%至5.5%的區間內,並且美聯儲主席鮑威爾表示,在下一次會議(3月)之前可能不會有足夠的數據來確定他們在通脹方面取得了足夠的進展以降低借貸成本。波士頓聯儲銀行行長蘇珊·柯林斯周三在波士頓經濟俱樂部表示:“目前,貨幣政策仍處於良好位置,我們正在仔細評估不斷變化的數據和前景。”在我們獲得更多信心時,我認為在今年晚些時候開始放鬆政策限制可能是合適的。”她表示,勞動力市場和經濟的強勁表現表明降溫需要一些時間,並且在開始降息時應該逐漸而有條理。 去年12月,大多數美聯儲政策制定者預測今年將進行三次或更多次降息。此後,通脹壓力繼續緩解,根據美聯儲的目標指標,即消費支出指數的年度變化,去年12月的通脹率為2.6%,根據最近六個月的趨勢為2%。經濟和勞動力市場的表現都超出了預期,美國國內生產總值上季度以3.3%的年化速度增長,美國僱主上個月新增了35.3萬個就業崗位。 美聯儲理事阿德里亞娜·庫格勒自去年9月上任以來首次發表公開評論。她表示,她“樂觀地”認為通脹進展將繼續,這得益於工資增長放緩和租金下降,但像她的同事們一樣,她表示需要更多數據來確保,如果通脹緩解停滯不前,她將支持將利率維持更長時間的穩定。她說:“從現在到今年年底以及未來的每次會議,無論是三月、五月還是六月,都將是活躍的。”分析師和金融市場預期都指向美聯儲將於4月30日至5月1日的會議上開始降息。
美国中央银行家希望在他们更有信心通胀会下降到2%之前不要降息,并且在周三提出了一系列理由,说明他们对于尽快开始宽松货币政策或者 一旦开始就迅速行动感到不急迫。 上周,美联储将政策利率保持在5.25%至5.5%的区间内,并且美联储主席鲍威尔表示,在下一次会议(3月)之前 可能不会有足够的数据来确定他们在通胀方面取得了足够的进展以降低借贷成本。 波士顿联储银行行长苏珊·柯林斯周三在波士顿经济俱乐部表示:“目前,货币政策仍处于良好位置,我们正在仔细评估不断变化的数据和前景。”在我们获得更多信心时,我认为在今年 晚些时候开始放松政策限制可能是合适的。 ”她表示,劳动力市场和经济的强劲表现表明降温需要一些时间,并且在开始降息时应该逐渐而有条理。 去年12月,大多数美联储 政策制定者预测今年将进行三次或更多次降息。此后,通胀压力继续缓解,根据美联储的目标指标,即消费支出指数的年度变化,去年12月的通胀率为2.6%,根据最近六个月 的趋势为2%。经济和劳动力市场的表现都超出了预期,美国国内生产总值上季度以3.3%的年化速度增长,美国雇主上个月新增了35.3万个就业岗位。 美联储理事阿德里亚娜·库格勒自去年9月上任以来首次发表公开评论。她表示,她“乐观地”认为通胀进展将继续,这得益 于工资增长放缓和租金下降,但像她的同事们一样,她表示需要更多数据来确保,如果通胀缓解停滞不前,她将支持将利率维持更长时间的稳定。她说:“从现在 到今年年底以及未来的每次会议,无论是三月、五月还是六月,都将是活跃的。 ”分析师和金融市场预期都指向美联储将于4月30日至5月1日的会议上开始降息。
根據一項調查顯示,英國服務業企業在2024年初表現強勁,新訂單持續增加,並且出現了六個月以來最快的人員招聘速度,這是因為降低利率的前景使得客戶更願意消費。 標準普爾全球服務業採購經理人指數(PMI)顯示,英國1月份的數值從12月份的53.4上升到54.3,是自2023年5月以來的最高水平,也比初步估計的53.8更強。 標準普爾全球市場情報公司的經濟學總監蒂姆·摩爾(Tim Moore)表示:“隨著經濟衰退風險的減退和金融環境的放寬,新訂單在今年冬季也出現了反彈,客戶更願意消費。” 服務業的良好表現與上周四公布的疲弱製造業數據形成對比,當時工廠報告稱由於紅海航運遭受襲擊,遞送至東亞的延遲。綜合PMI(包括兩項調查)在1月份從12月份的52.1上升到八個月來的最高水平52.9,反映了服務業規模更大的影響力。 上周,英國央行預測英國經濟將在2024年逐漸恢復,繼去年下半年停滯之後,這主要是由於通脹下降和市場對降息的預期。然而,英國央行的首席經濟學家休·皮爾(Huw Pill)表示,從目前的5.25%的利率下調利率仍然可能有一段時間,因為央行仍然擔心工資的迅速上漲和勞動密集型服務的成本。 周一的PMI調查顯示,薪資仍然是成本上升的主要驅動因素,這在一定程度上制約了招聘,但總體成本上升的速度是三年來最慢的。相對於四個月前,向客戶收取的價格增幅減小,但在絕對數值上仍然相對較高。摩爾表示:“較低的能源和燃料成本以及下降的原材料價格導致成本上升放緩。”
根据一项调查显示,英国服务业企业在2024年初表现强劲,新订单持续增加,并且出现了六个 月以来最快的人员招聘速度,这是因为降低利率的前景使得客户更愿意消费。 标准普尔全球服务业采购经理人指数(PMI)显示,英国1月份的数值从12月份的53.4上升到54.3,是自2023年 5月以来的最高水平,也比初步估计的53.8更强。 标准普尔全球市场情报公司的经济学总监蒂姆·摩尔(Tim Moore)表示:“随着经济衰退风险的减退和金融环境的放宽,新 订单在今年冬季也出现了反弹,客户更愿意消费。” 服务业的良好表现与上周四公布的疲弱制造业数据形成对比,当时工厂 报告称由于红海航运遭受袭击,递送至东亚的延迟。 综合PMI(包括两项调查)在1月份从12月份的52.1上升到八个月来的最高水平52.9,反映了服务业规模更大的影响力。 上周,英国央行预测英国经济将在2024年逐渐恢复,继去年下半年停滞之后,这主要是由于通胀下降和市场对降息的预期。 然而,英国央行的首席经济学家休·皮尔(Huw Pill)表示,从目前的5.25%的利率下调利率仍然可能有一段时间,因为央行仍然担心工资的迅速上涨和劳动密集型服务的成本。 周一的PMI调查显示,薪资仍然是成本上升的主要驱动因素,这在一定程度上制约了招聘,但总体成本上升的速度是三年来最 慢的。 相对于四个月前,向客户收取的价格增幅减小,但在绝对数值上仍然相对较高。 摩尔表示:“较低的能源和燃料成本以及下降的原材料价格导致成本上升放缓。”
黄金走国际金价上周被2大消息(FOMC+非农)带动,单日波幅明显扩大,但全周收盘最终都回到2040以下,未有任何明显结构上突破。 FOMC会后声明,联储局3月减息机率跌至现时15%(CME FedWatch Tools),令到减息的预期再次推后; 而连续2个月公布都比预期好的非农数据在周未收盘前将金价拉回2040以下区间。过去几周一直建议的区间操作虽然完全符合金市整体走势,阻力支持价亦合符预期,但上周太多市场不确定消息,操作难度可算是区间操作的Black Diamond级数,走势急而阔。
1小时图 – 本周没有重要经济数据公布 + 接近中国新年,相信本周的金市走势会回到2周前的区间动态模式。金价回到2040以下之后,现时可以继续把握2020-40(2)区间,短线阻力仍在2035-40(1),虽然豪无新意????????????,但相信未来48小时内应该能到达短线区间底部2020。
日线图 – 过去几周一直强调的2002-65(3)区间结构仍然有效,但现时价格被困在消化性三角(5)之中,要脱离三角形态后价格才能回到区间底部。短线支持继续留意20天移动均线(4)。
短线阻力 3
2055
短线阻力 2
2048-50
短线阻力 1
2040
现价
2034
短线支持 1
2030
短线支持 2
2027
短线支持 3
2020
P. To
风险提示: 场外式黄金/白银交易涉及高度风险,未必适合所有投资者。高度的杠杆可为阁下带来负面或正面的影响。阁下在决定买卖场外式黄金/白银之前应审慎考虑自己的投资目标、交易经验以及风险接受程度。可能出现的情况包括蒙受部分或全部初始投资额的损失,或在极端情况下(例如相关市场跳空)产生更多的损失。因此,阁下不应将无法承受损失的资金用于投资。投资应知悉买卖场外式黄金/白银有关的一切风险,如有需要,请向独立财务顾问寻求意见。市场资料仅供参考,我们绝不保证分析内容的准确性。
The gold price was under the influence of two major events last week, the FOMC meeting and the non-farm payrolls report, which resulted in significant daily fluctuations; however, the closing price for the entire week resumed its position below 2040, without any clear structural breakthrough. The post-FOMC statement kept the probability of a rate cut in March to a mere 15% (according to CME’s FedWatch Tools). Adding the non-farm payroll data on Fri., once again exceeded the market’s expectation for the second consecutive month and pulled the gold price back below the 2040 range before the week ended.
Although the range trading strategy we’ve been suggesting in recent weeks aligned perfectly with the overall trend in the gold market, and the resistance and support levels performed as expected, last week’s market involved too many uncertain factors. I would say the trading difficulty reached the “Black Diamond” level, with rapid and wide swings in the price movements.
1-Hour Chart – The difficulty of trading should ease down this week as no major economic data is being released, and with the approaching of the CNY holiday. The gold market is expected to resume the range-bound pattern & vibe we saw two weeks ago. After the gold price drops below 2040, we can continue to take advantage of the 2020-40(2)range. The S-T resistance zone remains in 2035-2040(1), nothing new ????????????. However, I believe that in the next 48 hours, we should see the price reaching the bottom of the S-T near 2020.
Daily Chart – The range structure we’ve been highlighting in the past few weeks, between 2002-65(3), is still valid. At the moment, the price is trapped within a consolidating triangle pattern(5). For the price to return to the bottom of the range, it needs to break out of the triangle formation. In S-T, keep an eye on the 20-day moving average as a support level.
S-T ressitance 3
2048
S-T ressitance 2
2040
S-T ressitance 1
2030
Market price
2034
S-T support 1
2030
S-T support 2
2027
S-T support 3
2020
P. To
Risk Disclosure: Gold Bullion/Silver (“Bullion”) trading carries a high degree of risk, and may not be suitable for all investors. The high degree of leverage can work against you as well as for you. This article is for reference only and is not a solicitation or advice to trade any currencies and investment products . Before deciding to trade Bullion you should carefully consider your investment objectives, level of experience, and risk appetite. The possibility exists that you could sustain a loss of some or all of your initial investment or even more in extreme circumstances (such as Gapping underlying markets) and therefore, you should not invest money that you cannot afford to lose. You should be aware of all the risks associated with trading Bullion, and seek advice from an independent financial advisor if you require. Client should not make investment decision solely based on the point of view and information on this article.
場外式黃金/白銀交易的風險:
Service relating to Over-the-counter (OTC) Gold Bullion/Silver trading is provided by MOL. OTC Gold/Silver Bullion trading carries a high degree of risk and may not be suitable for all investors. The high degree of leverage can work against you as well as for you. OTC Gold/Silver Bullion is not regulated by the Securities and Futures Commission (""SFC"") and therefore trading OTC Gold/Silver Bullion will not be subject to rules or regulations promulgated by the SFC. Before deciding to trade OTC Gold/Silver Bullion you should carefully consider your investment objectives, level of experience, and risk appetite. The possibility exists that you could sustain losses in excess of your deposited fund or even more in extreme circumstances and therefore, you should not invest money that you cannot afford to lose. You should be aware of all the risks associated with trading OTC Gold/Silver Bullion, and seek advice from an independent financial advisor if you require.
國際金價上週被2大消息(FOMC+非農)帶動,單日波幅明顯擴大,但全週收盤最終都回到2040以下,未有任何明顯結構上突破。FOMC會後聲明,聯儲局3月減息機率跌至現時15%(CME FedWatch Tools),令到減息的預期再次推後; 而連續2個月公佈都比預期好的非農數據在週未收盤前將金價拉回2040以下區間。過去幾週一直建議的區間操作雖然完全符合金市整體走勢,阻力支持價亦合符預期,但上週太多市場不確定消息,操作難度可算是區間操作的Black Diamond級數,走勢急而闊。
1小時圖 – 本週沒有重要經濟數據公佈 + 接近中國新年,相信本週的金市走勢會回到2週前的區間動態模式。金價回到2040以下之後,現時可以繼續把握2020-40(2)區間,短線阻力仍在2035-40(1),雖然豪無新意????????????,但相信未來48小時內應該能到達短線區間底部。
日線圖 – 過去幾週一直強調的2002-65(3)區間結構仍然有效,但現時價格被困在消化性三角(5)之中,要脫離三角形態後價格才能回到區間底部。短線支持繼續留意20天移動均線(4)。
短線阻力 3
2055
短線阻力 2
2048-50
短線阻力 1
2040
現價
2034
短線支持 1
2030
短線支持 2
2027
短線阻力 3
2020
P. To
風險提示: 場外式黃金/白銀交易涉及高度風險,未必適合所有投資者。高度的槓桿可為閣下帶來負面或正面的影響。閣下在決定買賣場外式黃金/白銀之前應審慎考慮自己的投資目標、交易經驗以及風險接受程度。可能出現的情況包括蒙受部分或全部初始投資額的損失,或在極端情況下(例如相關市場跳空)產生更多的損失。因此,閣下不應將無法承受損失的資金用於投資。投資應知悉買賣場外式黃金/白銀有關的一切風險,如有需要,請向獨立財務顧問尋求意見。市場資料僅供參考,我們絕不保証分析內容的準確性。
場外式黃金/白銀交易的風險:
Service relating to Over-the-counter (OTC) Gold Bullion/Silver trading is provided by MOL. OTC Gold/Silver Bullion trading carries a high degree of risk and may not be suitable for all investors. The high degree of leverage can work against you as well as for you. OTC Gold/Silver Bullion is not regulated by the Securities and Futures Commission (""SFC"") and therefore trading OTC Gold/Silver Bullion will not be subject to rules or regulations promulgated by the SFC. Before deciding to trade OTC Gold/Silver Bullion you should carefully consider your investment objectives, level of experience, and risk appetite. The possibility exists that you could sustain losses in excess of your deposited fund or even more in extreme circumstances and therefore, you should not invest money that you cannot afford to lose. You should be aware of all the risks associated with trading OTC Gold/Silver Bullion, and seek advice from an independent financial advisor if you require.
據一項調查顯示,在華美國企業對雙邊關係及其盈利潛力比一年前更加樂觀,但大多數企業目前仍會限制在華新投資。即便如此,總部位於北京的中國美國商會(AmCham)對其會員進行的調查顯示,中美關係仍然是他們的主要擔憂,其次是監管不一致、勞動力成本增加和資料安全擔憂。 中國美國商會主席肖恩·斯坦表示:“儘管近年來雙邊貿易有所擴大,但美國和中國之間的不信任仍然很高,關係緊張。”2023 年10 月,美國總統拜登和中國國家主席習近平在舊金山會晤之前,收集了343 名美國商會會員對這項調查的回复,這次會議被視為世界兩大經濟體之間關係正常化的重要一步。超過40%的受訪者表示,他們沒有計劃在2024年增加對中國的投資,另有37%的受訪者預計只會小幅增加。 中國英國商會去年12月發布的一項類似的情緒調查發現,英國企業也延後了在中國的新投資。美國商會調查的公司中有三分之一表示,與中國同行相比,他們受到了不公平的對待。 隨著美國和中國持續爭奪高科技霸主地位,科技業的股票跌幅最大。受訪的美國商會會員中有大約一半現在認為中國是全球三大優先事項,這一數字比去年的歷史最低點略有上升。 更多受訪者(39%)表示,與一年前相比,中國對美國企業的歡迎程度有所下降,而31% 的受訪者表示,中國對美國企業的歡迎程度有所提高,這反映出未來一年美國企業在中國面臨的複雜商業和地緣政治環境。
据一项调查显示,在华美国企业对双边关系及其盈利潜力比一年前更加乐观,但大多数企业目前仍会限制在华 新投资。 即便如此,总部位于北京的中国美国商会(AmCham)对其会员进行的调查显示,中美关系仍然是他们的主要担忧,其次是监管不一致、劳动力成本增加和资料安全担忧。 中国美国商会主席肖恩·斯坦表示:“尽管近年来双边贸易有所扩大,但美国和中国之间的不信任仍然很高 ,关系紧张。”2023 年10 月,美国总统拜登和中国国家主席习近平在旧金山会晤之前,收集了343 名美国商会会员对这项调查的回复,这次会议被视为世界两大经济体之间 关系正常化的重要一步。 超过40%的受访者表示,他们没有计划在2024年增加对中国的投资,另有37%的受访者预计只会小幅增加。 中国英国商会去年12月发布的一项类似的情绪调查发现,英国企业也延后了在中国的新投资。 美国商会调查的公司中有三分之一表示,与中国同行相比,他们受到了不公平的对待。 随着美国和中国持续争夺高科技霸主地位,科技业的股票跌幅最大。 受访的美国商会会员中有大约一半现在认为中国是全球三大优先事项,这一数字比去年的历史最低点略有上升。 更多受访者(39%)表示,与一年前相比,中国对美国企业的欢迎程度有所下降,而31% 的受访 者表示,中国对美国企业的欢迎程度有所提高,这反映出未来一年美国企业在中国面临的复杂商业和地缘政治环境。


