Technical Analysis
October 28, 2024

Gold Trend 28/10

The gold price hit our S-T target of 2750 last week, reaching a new high of 2758. However, the upward momentum failed to last, and the price couldn’t hold above 2750, dropping back to the weekly low of 2708. Towards the end of the week, the gold market once again priced in the risk premium ahead of the weekend’s geopolitical uncertainties, pushing the price back to 2750, and closing the week at 2747.

Last week, several Federal Reserve officials made comments suggesting a ‘cautious approach to rate cuts,’ which strengthened the US dollar and put pressure on gold prices. On the other hand, the market had been grappling with potential retaliatory actions from Israel against Iran for the past two weeks, which finally materialized over the weekend. The attacks were relatively restrained, focusing solely on military sites in Iran and avoiding oil and nuclear facilities. Tehran, so far, has not issued an immediate response. With no significant casualties, the geopolitical tensions eased as markets opened on Monday. The NYMEX oil, most directly affected, gapped open 4% lower, and gold prices also opened $10 lower.

A few crucial US data releases are scheduled from Tuesday to Friday this week, including consumer confidence, third-quarter GDP, core PCE inflation, non-farm payrolls, and the unemployment rate. A lot of uncertainty fills the week, but… considering most of the US economic figures released in the past few weeks have been relatively strong, we can anticipate downward pressures on gold prices prior to the outcome of these figures. As the US election enters its final stages, regardless of the outcome, there is a strong likelihood that the gap between the two candidates will narrow before election day, potentially leading to safe-haven funds flowing into the gold market to support the price, offsetting the downward pressure from strong data.

>

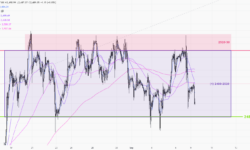
1-hr chart (above) > The price failed to hold above 2750 last week, causing the S-T trend to break below the upward support line (1). The upward momentum has begun to slow down, the support has shifted from the mid-week support line(2) to a slower pace(2.1) before the weekend. The key resistance zone is now sitting at last week’s high of 2750-2758 (4). If any US data falls short this week, the gold price may break above this resistance, triggering a new round of buying. However, before all those economic figures from the US, we can take advantage of the sideway range of 2710-50 (3) for S-T trading.

>

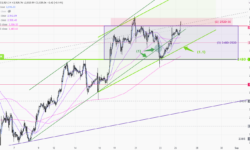
日線圖 (上圖) > 整體格局未有太大改變,關鍵阻力在 2750(5),而上升通道(6)仍然有效。

P. To

Technical Analysis
October 21, 2024

Gold Trend 21/10

Gold prices exceeded our expectations last week. They broke above the previous high of 2685 without any influence from major economic data or news, closing the week at a new high of 2722 before the weekend.

Early last week, gold prices continued to carry the upward momentum from the US inflation data from the previous week, jumping to the resistance at 2670. Although it was not a major market focus, weak US manufacturing data on Tuesday led to a technical breakout of the descending resistance line(1), triggering a round of buying that quickly pushed prices to the previous historical high of 2685.

After the ECB chopped the 0.5% rate and the release of US retail data on Thursday, the gold price cleared the resistance from the previous high of 2685, where the buying momentum carried on until Friday’s market close. As the Asian session opened on Monday, funds continued to flow in, so far no clear signs of a reversal yet.

Last week, the gold market shook off the influence of the US rate cut and the recent geopolitical factors, and the overall investment market is gradually being driven by the upcoming US election and its associated uncertainties. With the current market condition, “Trump trade” or not, the gold market, US stocks market, or cryptocurrencies, will be relatively bullish before the election date.

>

1-hr chart (above) > The upward trend is still accelerating, shifting from last week’s trend line (3) to a faster pace at (3.1). With gold prices hitting new highs, there are no previous prices to use as references. In the S-T, watch out for the round number of 2750; and a 1:1 projection from the previous week’s high/low range (4), with a target around 2765 (4.1).

>

Daily Chart > Gold prices broke through the key resistance at 2685 last week (5), reigniting the upward trend. The daily chart has not shown any reversal signals yet, so in the S-T, watch for resistance around 2750 near the upper resistance of the uptrend channel(6).

P. To

Technical Analysis
September 30, 2024

Gold Trend 30/09

Carrying the upward trend from the week before, gold prices hit a new high, pricing in the US Fed. additional 0.25% rate cut last week, in line with our expectations. The current uptrend started from 2550 after the meeting, and the upward momentum has finally slowed down after reaching a peak at 2685 on Thursday. The latest OI data from CME showed some slight profit-taking in the market before the weekend.

After the US Fed. meeting and China’s recent economic stimulation policies, the market is still in a kind of excited state. The CME fed. watch indicates that the probability of a 0.5% rate cut in November has increased from 48% at the end of last week to the latest 54% today. As long as the upcoming U.S. economic data in the next few weeks remains “normal,” and in line with market expectations. The gold market should behave the same as in late Aug. and early Sept. with a backdrop of the market speculating another 0.5% rate cut at the next Nov. meeting,

The focus this week is on Friday’s U.S. employment data. If the data exceeds expectations, gold may give us a deeper correction.

>

1-hour Chart > Last week’s target of 2645-50, based on the sideway range 1:1 ratio(2), has been achieved, and the price continues to break higher. However, it is important to note that the upward trend began to slow down towards the end of last week, with the upward momentum slowing further from support line(3.1) to (3.2) and then to (3.3). The S-T operating range is between 2645-85(5) for now. The key support level is at 2645 (4), and if this level is breached towards the end of this week, the operating range will shift down to 2600-2645.

>

Daily Chart > 2685 appears to be the current top. Temporarily takes the high and low of last Thu. and Fri.(7) as a trading reference(7). If the price breaks below 2645, the support line (6) and the 20-day MA should be the downside target in the coming two weeks.

P. To

Technical Analysis
September 23, 2024

Gold Trend 23/09

The uptrend has restarted since the gold prices broke out from the range of 2480-2530(1) two weeks ago. There was some S-T profit-taking after the US Fed announcement, however, the prices managed to clear the S-T resistance(3) before the weekend, hitting a new all-time high.

Before the US Fed. meeting, the market was merely expecting a 25 basis points cut, and the extra 25 basis points cut surprised everyone. Now the market needs additional time to price in this new factor, so gold prices are likely to keep going up in the S-T. Recently, people are more focused on how the U.S. economy is doing rather than inflation figures. This week, keep an eye on the U.S. 2Q GDP report coming out on Thursday. The PCE inflation data on Friday might not have a very big impact on gold prices.

>

1-hr Chart(above) > Gold prices have been running in an uptrend channel(2) in the past two weeks. While the price is hanging around its recent highs, there are no previous supports or resistances to reference from. However, remember the gold has been trading sideways between 2472-2530(4) in early September. Seems that each break-out is running the same range, around 56 dollars. After surpassing (4.1) last Friday, the first target for this week could be set at approximately 2646-50 (4.2), 1:1 ratio.

>

Daily Chart(above) > The upward momentum of gold prices is accelerating, and the upward support has shifted from (5) to (5.1). There is no obvious reversal signal on the daily chart, the buy-low strategy continues.

P. To

Technical Analysis
September 09, 2024

Gold Trend 09/09

Spot gold price has remained sideway in the past 2 weeks, with both the PCE price index and US employment data failing to bring new momentum to the market. The OI data from CME’s gold futures has stayed at around 510k for a while now, showing no significant changes in the numbers of long/short positions. This week’s focus is on Wednesday’s U.S. inflation data, no matter if it is good or bad, the market reaction should be like those major figures released previously. A week from the US interest rate meeting, it’s not easy for gold to escape the current range without any new stimulus. The market should give us more chances this week to take advantage of the sideways market. Just need to be cautious towards the end of this week, when the market may start to price-in further the US Fed. cut next week, leading to an early breakthrough.

>

1-hr chart > Continue to operate in the 2480-2520(1) range until the price escape.

>

Daily chart > The uptrend channel (2) is still dominating the gold market in M-T. S-T range remains in 2480-2530(3). If the price falls below 2480 before/after the Fed. meeting, a major consolidation will begin. a

P. To

Technical Analysis
August 26, 2024

Gold Trend 26/08

Gold price carried forward the upward momentum from the breaking of 2480 in the previous week, hitting a fresh record high of 2531 early last week. But the buying has reversed after the Fed. Meeting minutes were released during the US session on Wednesday. The price fell to the lowest of the week at 2470, and the week ended at 2510. There was no important US economic data last week, and Powell’s speech scheduled on Friday has controlled the market’s overall movement during the week. Although the final remarks were dovish, the market had already priced in the 0.25% rate cut in September, and in the absence of any new progress failed to stimulate the gold price to rise higher. In the next two weeks until the Fed meeting in mid-September, unless those economic figures during this period can drive the market to speculate on the half-percent interest rate cut in September, the rate-cutting factor will no longer be able to push up the gold price significantly in the short term. This week, pay attention to the US 2Q GDP on Thursday and the PCE price indexes on Friday.

>

1-hour chart(above) > The upward trend has slowed down to (1.1) after the gold price escaped channel(1). The current S-T resistance is at 2520-30(2). The range bound of 2480-2510 3) can be used as the operating range at the beginning of this week, until the next breakout

>

Daily Chart(above) > It will be the first sign for gold prices to break upward if it one day closes above 2513 on the daily chart. 2480 is the key support at the downside.

P. To

Global Shorts
August 15, 2024

Japan terminates strong earthquake warning for Nankai Trough disaster

 Japan on Thursday ended its warning of a higher-than-normal risk of a major earthquake, a week after strong shaking at the edge of the Nankai Trough seafloor prompted the government to issue its first-ever strong earthquake warning. Japan’s vice minister for disaster management, Yoshifumi Matsumura, said citizens can now resume normal life as there has been no abnormality in seismic activity in the Nankai Trough off Japan’s Pacific coast over the past week. A panel of experts from the Japan Meteorological Agency (JMA) issued an alert on August 8 saying there was a “relatively high probability” of a magnitude 9.0 earthquake in the Nankai Trough following a magnitude 7.1 quake in the country’s southwest. While the alert was not a definitive prediction, the government asked residents in large swaths of western and central Japan to reconsider evacuation procedures in the event of a severe earthquake and tsunami disaster.Japan predicts a 70%-80% chance of a major Nankai Trough earthquake within the next 30 years. The government’s worst-case scenario is that a Nankai Trough earthquake and subsequent tsunami disaster could kill 323,000 people, destroy 2.38 million buildings and cause economic losses of 220 trillion yen ($1.50 trillion).

Global Shorts
August 09, 2024

UK house prices rise most since January

 Data released by mortgage lender Halifax on Wednesday showed that UK house prices rose by the most in six months in July, indicating new momentum in the housing market. House prices rose 2.3% year-on-year, the biggest annual increase since January. The last time house prices rose more year-on-year was in February 2023, when they rose 2.5%.The Labour Party, which won a landslide victory in last month’s parliamentary election, promised to reform Britain’s planning system and set mandatory targets for faster housebuilding, but supply shortages are likely to remain a factor driving house prices in the medium term. In addition, last week, the Bank of England cut interest rates to 5% from a 16-year high of 5.25%, the first cut since March 2020. “Against the backdrop of falling mortgage rates and the possibility of further cuts in base rates, we expect house prices to continue to rise modestly over the rest of the year,” said Amanda Bryden, head of mortgages at Halifax.Other indicators of the housing market also show momentum is picking up. Last week, rival mortgage lender Nationwide said its measure of house prices rose 2.1% in the 12 months to July, the biggest annual increase since December 2022.

Global Shorts
August 06, 2024

U.S. services sector rebounds in July; employment also recovers

 U.S. service sector activity rebounded from a four-year low in July, with new orders rebounding and employment rising for the first time in six months, potentially helping to calm recession fears sparked by last month’s surge in unemployment and an ongoing stock market selloff. The Institute for Supply Management (ISM) said on Monday that its non-manufacturing purchasing managers’ index (PMI) rose to 51.4 last month from 48.8 in June, the lowest level since May 2020. A PMI reading above 50 indicates growth in the services sector, which accounts for more than two-thirds of the economy. The ISM believes that over time, readings above 49 generally indicate that the overall economy is expanding.Government data released on Friday showed the unemployment rate rose to 4.3% in July, the highest level in nearly three years, from 4.1% in June. The labor market is slowing as the Federal Reserve’s sharp interest rate hikes in 2022 and 2023 dampen demand. The U.S. central bank last week kept its benchmark overnight interest rate in a range of 5.25%-5.50%, a level it has held for more than a year, but opened the door to lower borrowing costs at its next meeting as early as September. Financial markets are also pricing in rate cuts in November and December.The ISM survey’s gauge of new orders rebounded to 52.4 from 47.3 in June, the lowest level since December 2022. Its services employment gauge rose to 51.1 from 46.1 in June, the first increase since January. The index rose 5 points, its second-biggest gain in more than three years, following a 6.7-point gain in January.This would support the view that the slowdown in nonfarm payrolls in July does not signal the start of a deterioration in the labor market. Nonfarm payrolls increased by 114,000 jobs last month, the second-smallest increase this year, while service providers added just 72,000 jobs, the first since December 2020 when both services and overall employment fell. lowest level. Services inflation picked up slightly in July, but that may not be enough to reverse weakening price pressures. The ISM service input payment price index rose slightly to 57.0 from 56.3 in June.

Technical Analysis
August 05, 2024

Gold Trend 05/08 – The spot gold price is losing upward momentum despite the expectations of a Fed. Rate cut increasing

The spot gold price went up during the week but fell after Friday’s US non-farm payroll report. Looking back at last week, the price broke through the 2400 resistance before the Fed—meeting on Wed. The price kept on rising after Powell’s dovish speech, and tensions rose in the Middle East as Iran’s leader ordered attacks on Israel in response to the assassination of a Hamas leader. The US released weaker-than-expected job data on Fri., causing gold prices to hit a weekly high and rechallenge the historical peak 2480. However, the market quickly focused on concerns that the US economy might enter a recession. US stocks rapidly fell from their highs, dragging gold prices down to a daily low of 2410, closing the week at 2442.

According to CME FedWatch, the latest interest rate futures indicate that the probability of a 50 basis point rate cut in September increased from 22% on Thursday to 95% early in the Monday Asian session. Whether in the gold or stock markets, a rate cut should boost the market. However, despite reaching twice above 2450 in the past month, the spot gold price didn’t have any significant new long-buying position above 2450 but profit-taking and new short-selling positions. The market now broadly expects the first rate cut to happen in September. As the first rate cut approaches, it is almost time for investors who entered long for the ‘rate cut’ concept at the beginning of the year to plan their exit. ‘Buy on the rumour, sell on the news’ ~ gold prices may still hit a new high before September, but expect a significant correction around the first rate cut!

>

1-hour Chart > The price still runs within the upward wedge(2). In the S-T, gold prices are supported by the trendline(2.1). If this support is broken, a significant correction may occur, with a target of 2400. Currently, the range of 2450-53 is acting as an S-T resistance zone, while stronger resistance is expected at 2478-80.

>

Daily Chart > No major economic data are expected to be released this week, and gold prices are unlikely to break high. The initial expectation is to work within the range of 2410-80 established last Friday.

P. To