
Gold prices have retreated from the high over the past two days. Yesterday, after the release of US retail sales data, it broke below last week’s low at 2013 (1), reaching a recent bottom of 2001 and the day ended at 2005.
1-hour chart – The trading range mentioned on Monday (2015-2065) was completed before yesterday’s US session. Influenced by the release of US data, prices fell below last week’s low (1). The support at 2000 is still relatively strong. Therefore, I expect the price to be bounded between 2000-20(2) in the next 24 hours. Unless the price breaks below the key support level at 2000, the overall trading pattern will likely be based on the expanded range of 2000-2065 (3).
Daily chart – The trend has been weak after a consecutive two-day decline of over $20, and it has breached the support zone of 2015-2022(4). With yesterday’s closing price near the daily low, the price action may suggest that there is still a chance of testing the 2000 level again today. Be alert; if it clears the buying orders at the support of 2000, the next target can be set around 1980 (5).
Weekly chart – The market is still focused on how soon the Fed will begin its first rate cut. According to CME’s FedWatch, the probability of a rate cut in March has dropped from 70% at the beginning of the week to only 60% now. It is important to pay attention to upcoming US data releases and the post-meeting statement from the Federal Reserve in January over the next few weeks. If US data continues to show strength, the timing of a rate cut may be delayed, and there could be a potential adjustment to lower levels in the M-T gold price (6).
S-T ressitance 3
2030
S-T ressitance 2
2020-22
S-T ressitance 1
2010-13
Market price
2008
S-T support 1
2000
S-T support 2
1995
S-T support 3
1990
P. To
Risk Disclosure: Gold Bullion/Silver (“Bullion”) trading carries a high degree of risk, and may not be suitable for all investors. The high degree of leverage can work against you as well as for you. This article is for reference only and is not a solicitation or advice to trade any currencies and investment products . Before deciding to trade Bullion you should carefully consider your investment objectives, level of experience, and risk appetite. The possibility exists that you could sustain a loss of some or all of your initial investment or even more in extreme circumstances (such as Gapping underlying markets) and therefore, you should not invest money that you cannot afford to lose. You should be aware of all the risks associated with trading Bullion, and seek advice from an independent financial advisor if you require. Client should not make investment decision solely based on the point of view and information on this article.
場外式黃金/白銀交易的風險:
Service relating to Over-the-counter (OTC) Gold Bullion/Silver trading is provided by MOL. OTC Gold/Silver Bullion trading carries a high degree of risk and may not be suitable for all investors. The high degree of leverage can work against you as well as for you. OTC Gold/Silver Bullion is not regulated by the Securities and Futures Commission (""SFC"") and therefore trading OTC Gold/Silver Bullion will not be subject to rules or regulations promulgated by the SFC. Before deciding to trade OTC Gold/Silver Bullion you should carefully consider your investment objectives, level of experience, and risk appetite. The possibility exists that you could sustain losses in excess of your deposited fund or even more in extreme circumstances and therefore, you should not invest money that you cannot afford to lose. You should be aware of all the risks associated with trading OTC Gold/Silver Bullion, and seek advice from an independent financial advisor if you require.
金价过去2天从高位回落,昨日美国公布零售数据后,失守上周低位2013(1),全日最低2001,最终收盘在2005。
1小时图 – 周一提及的区间(2015-65)操作,在昨日美盘前已经完成。受美国数据公布影响,昨日价格跌穿上周低位(1),但现时2000附近支持仍然较强。未来24小时预期价格将在2000-20(2)区间短线震荡,除非突破2000关键支持,否则整体会以扩大了的区间2000-65(3)为操作蓝本。
日线图 – 走势相对较弱,连续2日超过20美元的跌势,失守支持区2015-22(4),加上昨日收盘贴近全日低位收市,反影日内仍有机会再试2000附近低位。留意若成功跌穿2000支持,下一支持会在1980(5)
周线图 – 市场仍以美联储减息为焦点,跟据CME-FedWatch,现时3月份减息机会率已回落到只有60%。必须留意未来几周的美国数据及1月美联储会议的会后声明,若美国数据持续强势,减息时间会延迟,中线金价在机会调整至更低水平(6)。
短线阻力 3
2030
短线阻力 2
2020-22
短线阻力 1
2010-13
现价
2008
短线支持 1
2000
短线支持 2
1995
短线支持 3
1990
P. To
风险提示: 场外式黄金/白银交易涉及高度风险,未必适合所有投资者。高度的杠杆可为阁下带来负面或正面的影响。阁下在决定买卖场外式黄金/白银之前应审慎考虑自己的投资目标、交易经验以及风险接受程度。可能出现的情况包括蒙受部分或全部初始投资额的损失,或在极端情况下(例如相关市场跳空)产生更多的损失。因此,阁下不应将无法承受损失的资金用于投资。投资应知悉买卖场外式黄金/白银有关的一切风险,如有需要,请向独立财务顾问寻求意见。市场资料仅供参考,我们绝不保证分析内容的准确性。
金價過去2天從高位回落,昨日美國公佈零售數據後,失守上週低位2013(1),全日最低2001,最終收盤在2005。
1小時圖 – 週一提及的區間(2015-65)操作,在昨日美盤前已經完成。受美國數據公佈影響,昨日價格跌穿上週低位(1),但現時2000附近支持仍然較強。未來24小時預期價格將在2000-20(2)區間短線震蕩,除非突破2000關鍵支持,否則整體會以擴大了的區間2000-65(3)為操作藍本。
日線圖 – 走勢相對較弱,連續2日超過20美元的跌勢,失守支持區2015-22(4),加上昨日收盤貼近全日低位收市,反影日內仍有機會再試2000附近低位。留意若成功跌穿2000支持,下一支持會在1980(5)
週線圖 – 市場仍以美聯儲減息為焦點,跟據CME-FedWatch,現時3月份減息機會率已回落到只有60%。必須留意未來幾週的美國數據及1月美聯儲會議的會後聲明,若美國數據持續強勢,減息時間會延遲,中線金價在機會調整至更低水平(6)。
短線阻力 3
2030
短線阻力 2
2020-22
短線阻力 1
2010-13
現價
2008
短線支持 1
2000
短線支持 2
1995
短線阻力 3
1990
P. To
風險提示: 場外式黃金/白銀交易涉及高度風險,未必適合所有投資者。高度的槓桿可為閣下帶來負面或正面的影響。閣下在決定買賣場外式黃金/白銀之前應審慎考慮自己的投資目標、交易經驗以及風險接受程度。可能出現的情況包括蒙受部分或全部初始投資額的損失,或在極端情況下(例如相關市場跳空)產生更多的損失。因此,閣下不應將無法承受損失的資金用於投資。投資應知悉買賣場外式黃金/白銀有關的一切風險,如有需要,請向獨立財務顧問尋求意見。市場資料僅供參考,我們絕不保証分析內容的準確性。

在托運人和金融股的推動下,日本日經指數週一34年來首次突破36,000點大關,美國債券收益率回落和日元匯率企穩提振了市場情緒。日經指數 (.N225) 在觸及 1990 年 2 月以來最高點 36,008.23 點後,當天收盤上漲近 1%,至 35,901.73 點。 上週,日經指數創下 22 個月以來的最佳表現,價值股表現落後成長股。更廣泛的東證股價指數 (.TOPX) 的科技股權重低於日經指數,當天上漲 1.22%,盤中觸及 34 年來的新高。Topix 價值股分類指數 (.TOPXV) 上漲 1.55%,超過成長股分類指數 (.TOPXG) 0.88% 的漲幅。東京證券交易所 (TSE) 托運人指數 (.ISHIP.T) 上漲 5.3%,在 33 個行業類別中領漲,地緣政治風險推高了運費。週五大幅下跌的金融股強勁反彈。 東京證交所證券公司指數 (.ISECU.T) 上漲 4.56%,銀行業指數 (.IBNKS.T) 上漲 2.19%。 儘管有過熱跡象,日本股市仍持續上漲。 日經指數的一項備受關注的技術指標——相對強弱指數(RSI)攀升至 76.41,讀數高於 70 表示「超買」狀況。野村證券(Nomura Securities)策略師Kazuo Kamitani表示,“日經指數顯示出令人驚訝的強勢”,本週上漲速度可能會出現某種形式的調整。週一收盤後,東京證券交易所將開始公佈已披露提高資本效率計劃的每月公司名單,這又帶來了另一股推動力。T. Rowe Price 新興市場和日本股票投資組合專家 Daniel Hurley 表示,東京證券交易所的公司治理舉措「令人興奮不已」。“這就是為什麼外國投資者、激進投資者、對沖基金以及沃倫·巴菲特和伯克希爾·哈撒韋今天密切關注日本。”

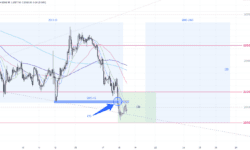
Gold tested the support at 2020 twice last week and officially bottomed out after the release of US inflation data. It then rebounded and reached a high of 2062 before closing the week at 2048. However, it failed to hold above the 2050 level.
1-hour chart – Gold broke through the downward resistance line(1), originating from the 2088 peak during the US trading session last Fri, marking the end of the S-T downward cycle on the hourly chart. The price again surpassed the 2050 resistance late last week, showing a sign of the selling resistance gradually weakening at that level. The trading range is expected to broaden, expanding from the previous range of 2020-50 to 2015-2065(2).
Daily chart – After gold broke away from the upward support(3), it touched the 50-day MA last week (6), forming a sideways structure in the range of 2015-2065(4). Flow with the 2015-65(4) range for now, with S-T support at 2048 (20-day MA) and a stop-loss above the resistance zone of 2070-2079.
S-T ressitance 3
2065
S-T ressitance 2
2060
S-T ressitance 1
2056
Market price
2055
S-T support 1
2048-50
S-T support 2
2043
S-T support 3
2040
P. To
Risk Disclosure: Gold Bullion/Silver (“Bullion”) trading carries a high degree of risk, and may not be suitable for all investors. The high degree of leverage can work against you as well as for you. This article is for reference only and is not a solicitation or advice to trade any currencies and investment products . Before deciding to trade Bullion you should carefully consider your investment objectives, level of experience, and risk appetite. The possibility exists that you could sustain a loss of some or all of your initial investment or even more in extreme circumstances (such as Gapping underlying markets) and therefore, you should not invest money that you cannot afford to lose. You should be aware of all the risks associated with trading Bullion, and seek advice from an independent financial advisor if you require. Client should not make investment decision solely based on the point of view and information on this article.
場外式黃金/白銀交易的風險:
Service relating to Over-the-counter (OTC) Gold Bullion/Silver trading is provided by MOL. OTC Gold/Silver Bullion trading carries a high degree of risk and may not be suitable for all investors. The high degree of leverage can work against you as well as for you. OTC Gold/Silver Bullion is not regulated by the Securities and Futures Commission (""SFC"") and therefore trading OTC Gold/Silver Bullion will not be subject to rules or regulations promulgated by the SFC. Before deciding to trade OTC Gold/Silver Bullion you should carefully consider your investment objectives, level of experience, and risk appetite. The possibility exists that you could sustain losses in excess of your deposited fund or even more in extreme circumstances and therefore, you should not invest money that you cannot afford to lose. You should be aware of all the risks associated with trading OTC Gold/Silver Bullion, and seek advice from an independent financial advisor if you require.
黄金在上周2次测试2020底部支持,在美国公布通胀数据后正式见底反弹,随后触及高位2062,全周收盘在2048,未能企稳2050之上。
1小时图 – 上周五美盘交易时段正式突破了源自2088高位的下降阻力线(1),1小时图的短线下降周期已正式完结。上周尾再次穿越2050阻力,现时2050的沽盘(空单)阻力正渐渐减弱,预期震荡区间将会扩阔,由上周提及的2020-50扩大至2015-65(2)。
日线图 – 自黄金脱离上升支持(3)后,上周触及50天移动均线后(6),横行结构2015-65(4)已形成。现时可继续把握区间(4)操作,短线支持在2048(20天移动均线),上方止损在阻力区2070-79。
短线阻力 3
2065
短线阻力 2
2060
短线阻力 1
2056
现价
2055
短线支持 1
2048-50
短线支持 2
2043
短线支持 3
2040
P. To
風險提示: 場外式黃金/白銀交易涉及高度風險,未必適合所有投資者。高度的槓桿可為閣下帶來負面或正面的影響。閣下在決定買賣場外式黃金/白銀之前應審慎考慮自己的投資目標、交易經驗以及風險接受程度。可能出現的情況包括蒙受部分或全部初始投資額的損失,或在極端情況下(例如相關市場跳空)產生更多的損失。因此,閣下不應將無法承受損失的資金用於投資。投資應知悉買賣場外式黃金/白銀有關的一切風險,如有需要,請向獨立財務顧問尋求意見。市場資料僅供參考,我們絕不保証分析內容的準確性。
黃金在上週2次測試2020底部支持,在美國公佈通脹數據後正式見底反彈,隨後觸及高位2062,全週收盤在2048,未能企穩2050之上。
1小時圖 – 上週五美盤交易時段正式突破了源自2088高位的下降阻力線(1),1小時圖的短線下降週期已正式完結。上週尾再次穿越2050阻力,現時2050的沽盤(空單)阻力正漸漸減弱,預期震蕩區間將會擴闊,由上週提及的2020-50擴大至2015-65(2)。
日線圖 – 自黃金脫離上升支持(3)後,上週觸及50天移動均線後(6),橫行結構2015-65(4)已形成。現時可繼續把握區間(4)操作,短線支持在2048(20天移動均線),上方止損在阻力區2070-79。
短線阻力 3
2065
短線阻力 2
2060
短線阻力 1
2056
現價
2055
短線支持 1
2048-50
短線支持 2
2043
短線阻力 3
2040
P. To
風險提示: 場外式黃金/白銀交易涉及高度風險,未必適合所有投資者。高度的槓桿可為閣下帶來負面或正面的影響。閣下在決定買賣場外式黃金/白銀之前應審慎考慮自己的投資目標、交易經驗以及風險接受程度。可能出現的情況包括蒙受部分或全部初始投資額的損失,或在極端情況下(例如相關市場跳空)產生更多的損失。因此,閣下不應將無法承受損失的資金用於投資。投資應知悉買賣場外式黃金/白銀有關的一切風險,如有需要,請向獨立財務顧問尋求意見。市場資料僅供參考,我們絕不保証分析內容的準確性。
場外式黃金/白銀交易的風險:
Service relating to Over-the-counter (OTC) Gold Bullion/Silver trading is provided by MOL. OTC Gold/Silver Bullion trading carries a high degree of risk and may not be suitable for all investors. The high degree of leverage can work against you as well as for you. OTC Gold/Silver Bullion is not regulated by the Securities and Futures Commission (""SFC"") and therefore trading OTC Gold/Silver Bullion will not be subject to rules or regulations promulgated by the SFC. Before deciding to trade OTC Gold/Silver Bullion you should carefully consider your investment objectives, level of experience, and risk appetite. The possibility exists that you could sustain losses in excess of your deposited fund or even more in extreme circumstances and therefore, you should not invest money that you cannot afford to lose. You should be aware of all the risks associated with trading OTC Gold/Silver Bullion, and seek advice from an independent financial advisor if you require.

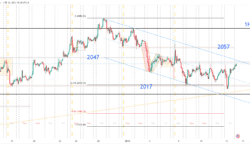
上週三歐盤時段出現強勁的下跌動能,直接打穿2057和2047兩個支持位,雖然週四晚出現反彈,但力量明顯不及左邊的下跌強,而且亦未有打破下跌結構。短線操作的話,可留意阻力位2057,這位置是週三的突破位,而且週五晚出數據後,價格向下收了支針,形成了下跌通道,2057就在下跌通道頂附近,短線可在這佈署向下,目標係通道底剛好又是2017的互換位。 價格來到2017後反彈力弱和出現震盪,直到昨晚出現較強的急跌急升,從4H圖看2017是早前升段的0.618,明顯互換位和上升趨勢線上,在這佈署較為有利。但要留意價格2042這位置,因為這是前頂,前橫行中線和下跌通道頂,等明顯升穿再揾位入會較有利。K.Lam風險提示: 場外式黃金/白銀交易涉及高度風險,未必適合所有投資者。高度的槓桿可為閣下帶來負面或正面的影響。閣下在決定買賣場外式黃金/白銀之前應審慎考慮自己的投資目標、交易經驗以及風險接受程度。可能出現的情況包括蒙受部分或全部初始投資額的損失,或在極端情況下(例如相關市場跳空)產生更多的損失。因此,閣下不應將無法承受損失的資金用於投資。投資應知悉買賣場外式黃金/白銀有關的一切風險,如有需要,請向獨立財務顧問尋求意見。市場資料僅供參考,MAX Online 絕不保証分析內容的準確性。

中國海關週五公佈的數據顯示,2023年中國與俄羅斯的雙向貿易額達到2400億美元,再創新高,儘管烏克蘭戰爭仍在繼續,但兩國仍在推動更緊密的經濟聯繫。 。 中國是世界最大的石油消費國之一,已成為目前受到西方制裁的能源出口國俄羅斯的主要經濟命脈。 隨著歐洲和美國品牌退出俄羅斯市場,莫斯科也加強了從汽車到智慧型手機等中國商品的購買力道。 中國海關總署數據顯示,2023年中俄美元貿易額達2,401億美元,年增26.3%。海關數據顯示,2023年中國對俄羅斯的出口量年增46.9%,與俄烏戰爭前的2021年相比暴增64.2%。自2022 年以來,去年從俄羅斯的進口成長了 13%。俄羅斯國家通訊社引述俄羅斯副總理亞歷山大·諾瓦克12月底的話說,2023年俄羅斯石油出口的一半已運往中國。中國海關未公佈12月份自俄羅斯石油進口數據。 兩國領導人和官員去年舉行了多次雙邊會談,盛贊兩國「無限」的夥伴關係。中國駐俄羅斯大使張漢暉12月19日對俄羅斯國家通訊社RIA表示,北京有意擴大與俄羅斯在各個生產階段的能源合作。儘管俄羅斯在西方制裁期間增加了人民幣進口支付,但中國也增加了使用人民幣購買俄羅斯商品。海關數據顯示,以人民幣計算,去年中俄雙向貿易額為1.69兆元(合2,359億美元),較去年成長32.7%
上周三欧盘时段出现强劲的下跌动能,直接打 穿2057和2047两个支持位,虽然周四晚出现反弹,但力量明显不及左边的下跌强,而且亦未有打破下跌结构。 短线操作的话,可留意阻力位2057,这位置是周三的突破位,而且周五晚出数据后,价格向下收了支针,形成了下跌通道,2057就在下跌通道顶附近,短线可 在这布署向下,目标系通道底刚好又是2017的互换位。 价格来到2017后反弹力 弱和出现震荡,直到昨晚出现较强的急跌急升,从4H图看2017是早前升段的0.618,明显互换位和上升趋势线上,在这布署较为有利。 但要留意价格2042这位置,因为这是前顶,前横行中线和下跌通道顶,等明显升穿再揾位入会较有利。 K.Lam风险提示: 场外式黄金/白银交易涉及高度风险,未必适合所有投资者。 高度的杠杆可为阁下带来负面或正面的影响。 阁下在决定买卖场外式黄金/白银之前应审慎考虑自己的投资目标、交易经验以及风险接受程度。 可能出现的情况包括蒙受部分或全部初始投资额的损失,或在极端情况下(例如相关市场跳空)产生更多的损失。 因此,阁下不应将无法承受损失的资金用于投资。 投资应知悉买卖场外式黄金/白银有关的一切风险,如有需要,请向独立财务顾问寻求意见。 市场资料仅供参考,MAX Online 绝不保证分析内容的准确性。