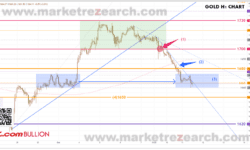
Gold touched a new 1-week low yesterday. The day began at 1667, and the price was traded between 1660-71 throughout the Asian & European sessions. A rapid jump to the day-high 1684 occurred at the US session, but the price got pull-back led to the day ending at 1665, down by USD 2.
The S-T selling trend originated from 1710 has ended yesterday after the price climbed above the downward trendline(1). Waiting for the US Fed. Minutes later today, the price is settling in a tight range between 1660-80(2).

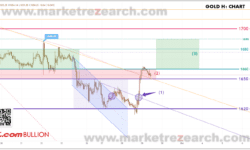
Gold’s pull-back from 1684 yesterday has created a selling signal(4) on the daily chart. The trend on the daily chart remains bearish, and the resistance at the 20-day MA(5) remains in effect.
S-T Resistances:
1680
1676
1670
Market price: 1667
S-T Supports:
1665
1660
1655
Risk Disclosure: Gold Bullion/Silver (“Bullion”) trading carries a high degree of risk, and may not be suitable for all investors. The high degree of leverage can work against you as well as for you. This article is for reference only and is not a solicitation or advice to trade any currencies and investment products . Before deciding to trade Bullion you should carefully consider your investment objectives, level of experience, and risk appetite. The possibility exists that you could sustain a loss of some or all of your initial investment or even more in extreme circumstances (such as Gapping underlying markets) and therefore, you should not invest money that you cannot afford to lose. You should be aware of all the risks associated with trading Bullion, and seek advice from an independent financial advisor if you require. Client should not make investment decision solely based on the point of view and information on this article.