Gold price carried forward the upward momentum from the breaking of 2480 in the previous week, hitting a fresh record high of 2531 early last week. But the buying has reversed after the Fed. Meeting minutes were released during the US session on Wednesday. The price fell to the lowest of the week at 2470, and the week ended at 2510. There was no important US economic data last week, and Powell’s speech scheduled on Friday has controlled the market’s overall movement during the week. Although the final remarks were dovish, the market had already priced in the 0.25% rate cut in September, and in the absence of any new progress failed to stimulate the gold price to rise higher. In the next two weeks until the Fed meeting in mid-September, unless those economic figures during this period can drive the market to speculate on the half-percent interest rate cut in September, the rate-cutting factor will no longer be able to push up the gold price significantly in the short term. This week, pay attention to the US 2Q GDP on Thursday and the PCE price indexes on Friday.
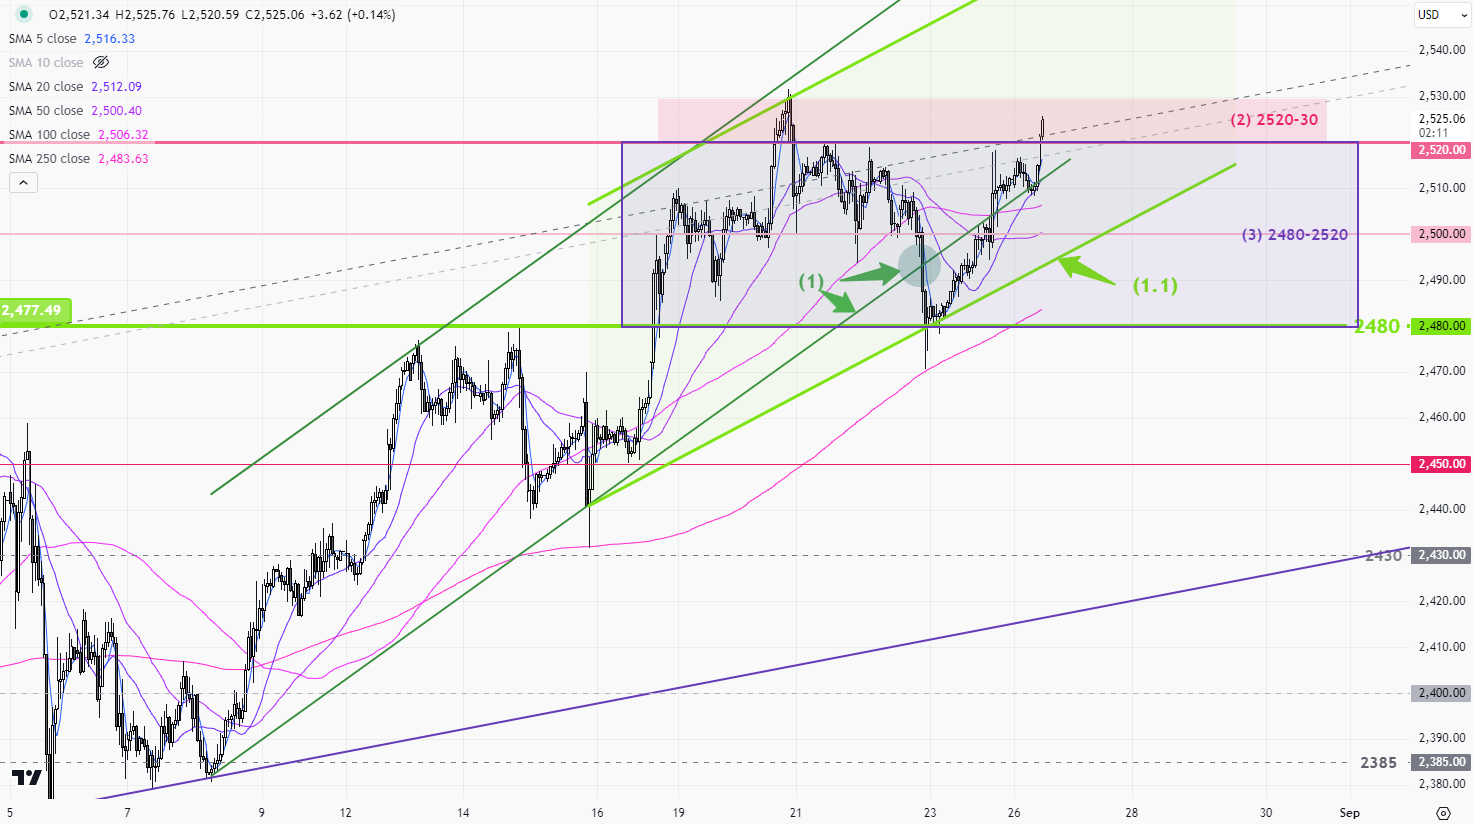
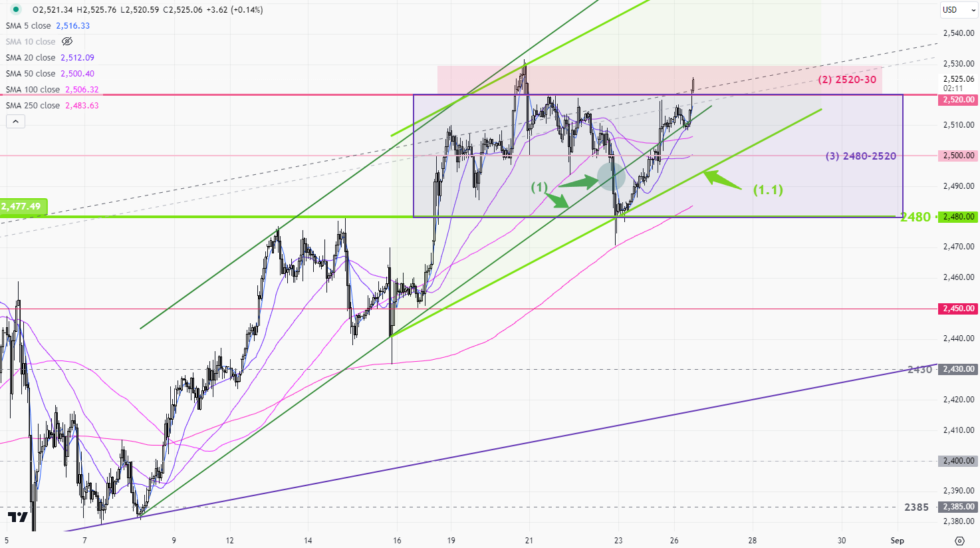
1-hour chart(above)> The upward trend has slowed down to (1.1) after the gold price escaped channel(1). The current S-T resistance is at 2520-30(2). The range bound of 2480-2510 3) can be used as the operating range at the beginning of this week, until the next breakout
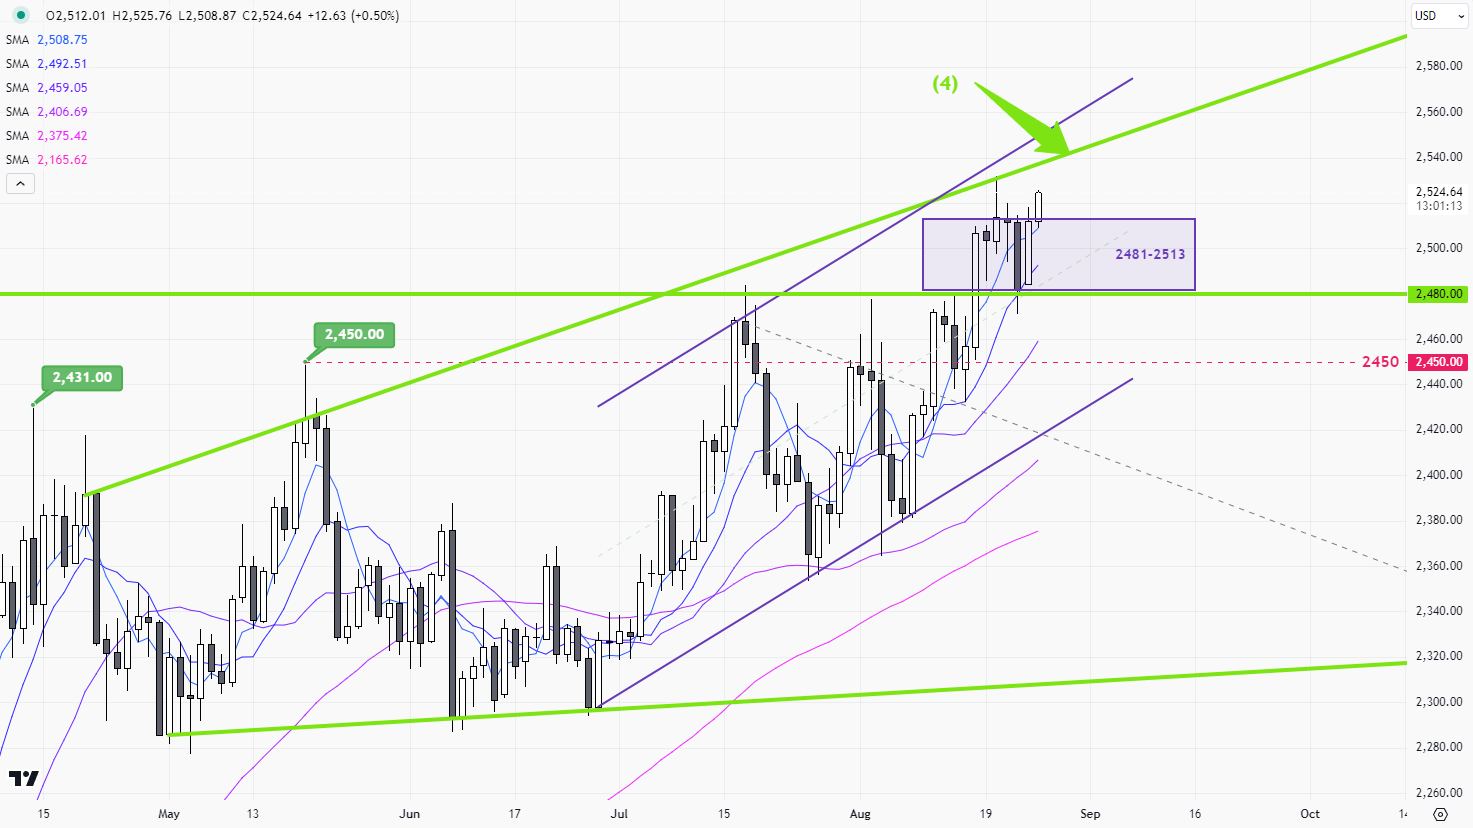
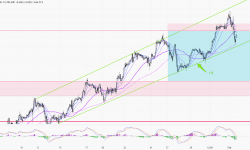
Daily Chart(above)> It will be the first sign for gold prices to break upward if it one day closes above 2513 on the daily chart. 2480 is the key support at the downside.
P. To


