Gold had pullback before the day’s end yesterday. The market opened at 1642 back from the weekend. The price has kept moving higher in the Asian and European sessions. It hit the day-high 1668 at the US session opening, then the price retraced. The day ended at 1650, up by USD8 after all.
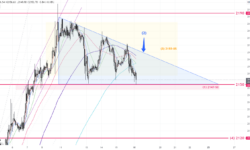
The downtrend on the 1-hour chart slowed down yesterday after the price jumped above the trendline(1), shifting the S-T downtrend from (1) to (1.1). Before the next break, expect the price to settle in between 1640-65(2) for now.

Overall the trend is still bearish, and a new bearish signal(3) has appeared after the pullback from 1668 yesterday. The resistance at 1665(4) & the 20 days MA(5) are blocking all the climb for now. Once the price clears the support at 1640, gold should be able to consolidate further.
S-T Resistances:
1670
1665
1660
Market price: 1659
S-T Supports:
1655
1650
1645
Risk Disclosure: Gold Bullion/Silver (“Bullion”) trading carries a high degree of risk, and may not be suitable for all investors. The high degree of leverage can work against you as well as for you. This article is for reference only and is not a solicitation or advice to trade any currencies and investment products . Before deciding to trade Bullion you should carefully consider your investment objectives, level of experience, and risk appetite. The possibility exists that you could sustain a loss of some or all of your initial investment or even more in extreme circumstances (such as Gapping underlying markets) and therefore, you should not invest money that you cannot afford to lose. You should be aware of all the risks associated with trading Bullion, and seek advice from an independent financial advisor if you require. Client should not make investment decision solely based on the point of view and information on this article.