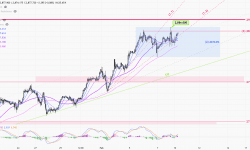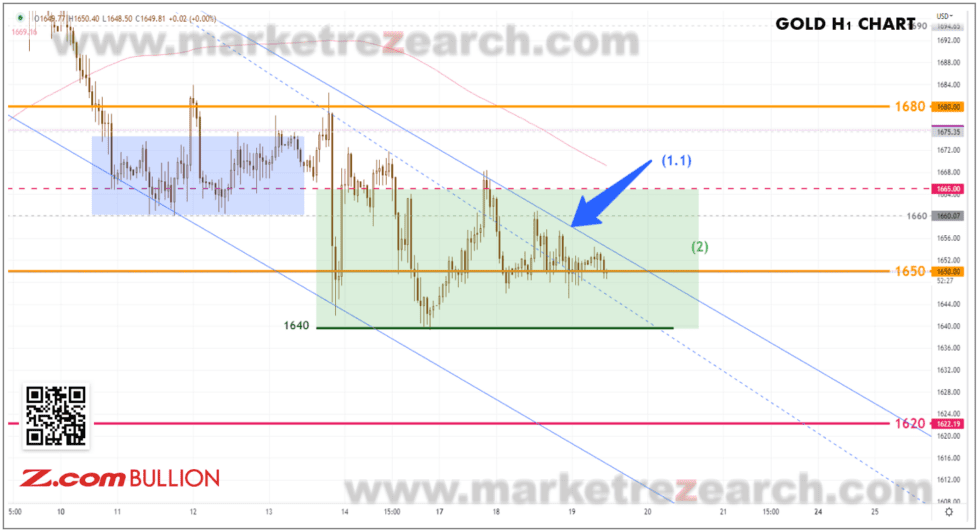

Gold traded in a tight range yesterday. The overall daily movement was pretty much like the day before – pulling back before the day’s end.; the price climbed to the day-high 1660 in the early session and retraced back to the opening price of 1650 before the day’s end.
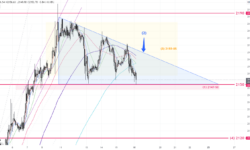
The S-T trend is still controlled by the S-T downtrend resistance (1.1) that was mentioned yesterday. Overall, the market is bearish. However, the short-selling before 1650 is still relatively weak. Due to the lack of momentum, expect the price to remain within 1640-65(2) until it escapes.

The pullbacks before the day’s end on the second consecutive day have created another bearish signal on the daily chart. Wait for the signal; a new round of selling should only begin if the price close below 1650 on the daily chart; before that, the price should continue to wander around 1650.
S-T Resistances:
1665
1660
1655
Market price: 1651
S-T Supports:
1650
1645
1640
Risk Disclosure: Gold Bullion/Silver (“Bullion”) trading carries a high degree of risk, and may not be suitable for all investors. The high degree of leverage can work against you as well as for you. This article is for reference only and is not a solicitation or advice to trade any currencies and investment products . Before deciding to trade Bullion you should carefully consider your investment objectives, level of experience, and risk appetite. The possibility exists that you could sustain a loss of some or all of your initial investment or even more in extreme circumstances (such as Gapping underlying markets) and therefore, you should not invest money that you cannot afford to lose. You should be aware of all the risks associated with trading Bullion, and seek advice from an independent financial advisor if you require. Client should not make investment decision solely based on the point of view and information on this article.