The price of gold fluctuated within a narrow range yesterday. It opened at 2006, last Friday’s closing price. In the early Asian session, it had fallen below 2000, and the rest of the day the price stayed within a tight range between 1990 and 2000 throughout the rest of the day.
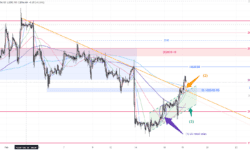
1-hour chart – The uptrending momentum has slowed down. The price broke out from the upward channel (1) yesterday. Expected the price to fluctuate between 1980 and 2020. Pay close attention to the US Fed meeting meeting, the next major move should occur after the announcement.

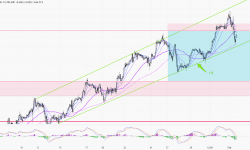
Daily Chart – The upward trend that originated from 1809 has slowed down in the last few trading days. Before the breakout, traders can take advantage of the 1955-97(3) range.
S-T Resistances:
2020
2008-10
2000
Market price: 1995
S-T Supports:
1990
1985
1980
Risk Disclosure: Gold Bullion/Silver (“Bullion”) trading carries a high degree of risk, and may not be suitable for all investors. The high degree of leverage can work against you as well as for you. This article is for reference only and is not a solicitation or advice to trade any currencies and investment products . Before deciding to trade Bullion you should carefully consider your investment objectives, level of experience, and risk appetite. The possibility exists that you could sustain a loss of some or all of your initial investment or even more in extreme circumstances (such as Gapping underlying markets) and therefore, you should not invest money that you cannot afford to lose. You should be aware of all the risks associated with trading Bullion, and seek advice from an independent financial advisor if you require. Client should not make investment decision solely based on the point of view and information on this article.