
Keep an eye on the gold price for a downward adjustment after the US CPI this week.
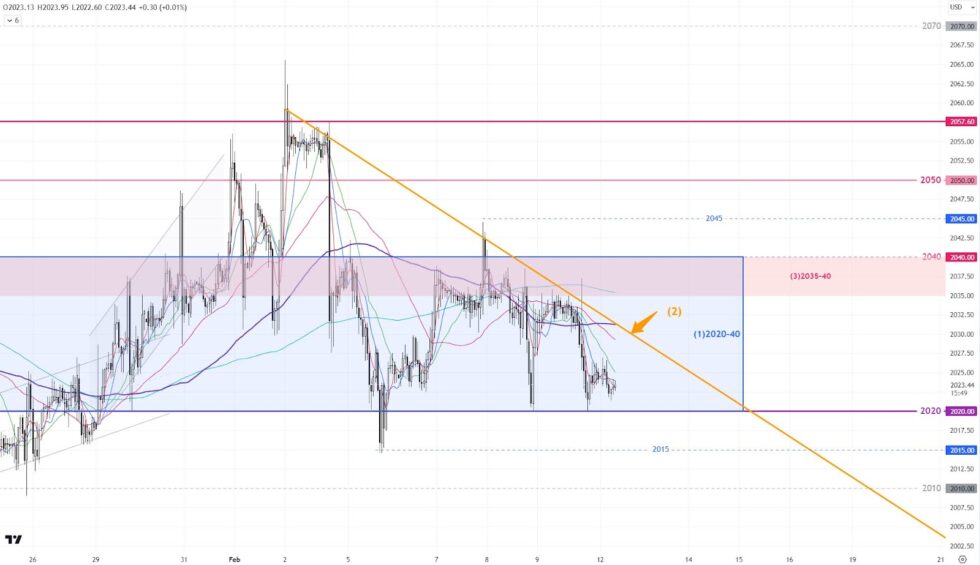
The gold market was relatively calm last week; the trading volume of COMEX gold futures noticeably declined, dropping from an average daily volume of over 200,000 contracts in Jan. to only 140,000 since the beginning of the week. Adding that no significant economic data was being released, the price mainly bounced within the range of 2020-2040(1). As expected, we hope everyone took advantage of the situation✊. The trend hasn’t changed much after a week of sideways movement. The key focus this week, without a doubt, is the US CPI data on Tuesday. I expect the data to push the gold price higher towards the resistance zone around 2035-2040(3). Whether it can jump across 2050 will very much depend on whether the data release brings any surprises. On the other hand, according to CME’s FedWatch, the probability of a rate cut in March has decreased to around 60%, so the chances of gold reaching new highs in the S-T are slim. The S-T price will likely continue oscillating within the sideway range… but still be mindful of a potential deeper consolidating cycle.
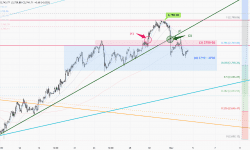
1-hour chart – We can continue utilizing the 2020-40(1) range for S-T. Keep an eye on the downward resistance line formed last week(2). If the price breaks above this resistance line within the next 48 hours, it will trigger a round of buying orders, and the price may reach once again the 2040 resistance zone (3). The key support level below is at 2015.

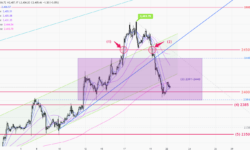
Daily chart – Although the upward trendline (4) is still valid, the probability of a rate cut in May is declining. Unless US inflation significantly slows down in the next two weeks, it will be difficult for the gold price to maintain its current upward movement above the trendline(4). If the gold price falls below the support line (4) in this week, it will trigger a round of selling, and the price is likely to test the bottom of the 2002-2065 range (5) again.
|
S-T ressitance 3 |
2040 |
|
S-T ressitance 2 |
2035 |
|
S-T ressitance 1 |
2030 |
|
Market price |
2024 |
|
S-T support 1 |
2020 |
|
S-T support 2 |
2015 |
|
S-T support 3 |
2008-10 |
P. To
Risk Disclosure: Gold Bullion/Silver (“Bullion”) trading carries a high degree of risk, and may not be suitable for all investors. The high degree of leverage can work against you as well as for you. This article is for reference only and is not a solicitation or advice to trade any currencies and investment products . Before deciding to trade Bullion you should carefully consider your investment objectives, level of experience, and risk appetite. The possibility exists that you could sustain a loss of some or all of your initial investment or even more in extreme circumstances (such as Gapping underlying markets) and therefore, you should not invest money that you cannot afford to lose. You should be aware of all the risks associated with trading Bullion, and seek advice from an independent financial advisor if you require. Client should not make investment decision solely based on the point of view and information on this article.